
The short answer: Quality Score improves when your keyword, your ad, and your landing page all match the exact intent of the person searching. Google rewards the user finding precisely what they expected — and it measures this through click behaviour before and after the click.
After managing Google Ads accounts for more than 15 years across four countries and budgets ranging from 5,000 rupees a month to 50,000 dollars a month, one thing is absolutely clear: Google’s official explanation of Quality Score tells you what it measures — but it does not tell you why it behaves the way it does inside real campaigns.
Most advertisers read the official definition, nod along, and then watch their Quality Score stay stubbornly at 4 or 5 for months while their costs keep climbing. This article is about the gap between the official explanation and what actually works.
What Google Officially Says
According to Google’s own support documentation, Quality Score is determined by three factors:
- Expected click-through rate — how likely your ad is to be clicked when shown
- Ad relevance — how closely your ad matches the intent behind the search
- Landing page experience — how relevant and useful your landing page is to the searcher
Each factor is rated Below Average, Average, or Above Average. The combination produces a score from 1 to 10. A score of 7 or above is generally considered good. A score of 3 or below is a serious problem that will inflate your costs significantly.
Source: Google Ads Help Centre — “About Quality Score” (support.google.com/google-ads)
Why the Official Explanation Is Incomplete
Here is what Google does not openly say: Quality Score is deeply influenced by what happens after someone clicks your ad. The bounce rate on your landing page, the time users spend on your page, and whether they immediately return to Google search results — all of these appear to feed back into how Google evaluates your campaign over time.
“Half the money I spend on advertising is wasted; the trouble is I don’t know which half.”
— John Wanamaker, department store merchant and marketing pioneer
This quote, more than a century old, still describes how most advertisers feel about Google Ads. Quality Score is Google’s attempt to solve exactly this problem — rewarding advertisers who spend their money connecting the right person to the right answer, and penalising those who waste impressions on mismatched searches.
Real Story: How a Clients Campaign Went From Quality Score 4 to Quality Score 9 in Three Weeks
Priya ran a home cleaning business in a mid-sized Indian city. She had been running Google Ads on her own for eight months, spending approximately 35,000 rupees per month and generating around 14 leads. Her cost per lead was roughly 2,500 rupees.
When the account was audited, the problem was immediately visible. Not the ads. Not the keywords. The structure.
She had one campaign, one ad group, and 47 keywords — ranging from “emergency same-day cleaning” all the way to “spring cleaning checklist tips for apartments.” Every single one of those keywords sent traffic to her homepage, which talked about her company history, her seasonal packages, and her team.
Google saw the disconnect. A person searching “emergency same day house cleaning” was landing on a page about seasonal promotions. They left within seconds. Multiply that by thousands of clicks and Google’s system quietly learned: this ad and landing page combination does not satisfy searchers. Reduce Quality Score. Increase cost per click.
What Changed
- Split the 47 keywords into three tightly focused ad groups: emergency cleaning, regular scheduled cleaning, and move-out cleaning
- Created three separate landing pages — one for each intent, with headlines matching the search term almost exactly
- Rewrote every ad so the headline mirrored the keyword the person had typed
- Added 22 negative keywords to stop paying for cleaning tips, DIY guides, and job seeker searches
Results after 21 days — same budget throughout:
| Metric | Before | After |
|---|---|---|
| Average cost per click | Rs 2.80 equivalent | Rs 1.65 equivalent |
| Quality Score (primary keywords) | 4 to 5 | 7 to 9 |
| Conversion rate | 3.2% | 6.1% |
| Monthly leads | 14 | 31 |
| Cost per lead | Rs 2,500 | Rs 940 |
Source: Anonymised client account data from campaign managed by the author, 2023.
The Five Real Factors That Move Quality Score
1. Intent Alignment — Not Just Keyword Matching
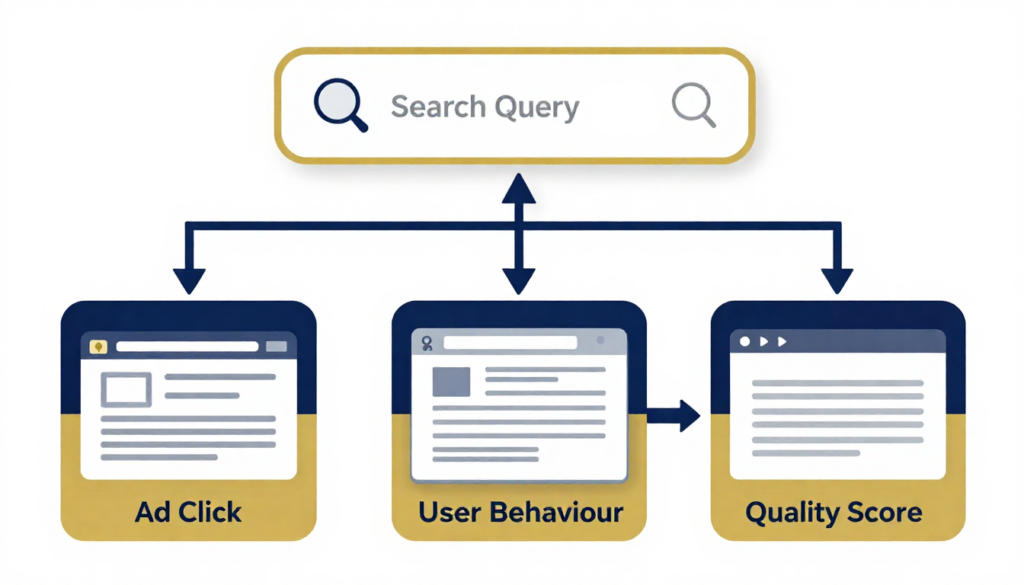
Google does not simply check whether your keyword appears in your ad. It checks whether the entire journey is coherent: search term → ad headline → landing page → user behaviour on the page. When there is a mismatch at any point in that chain, Quality Score suffers.
A study by WordStream analysing over 2,000 Google Ads accounts found that accounts with a Quality Score of 8 or above paid on average 37% less per click than accounts sitting at a Quality Score of 5.
Source: WordStream — “Google Ads Benchmarks for YOUR Industry” (wordstream.com/google-ads)
2. Click Quality Over Click Quantity
In Priya’s case, her emergency cleaning ad group had a lower click-through rate than her general cleaning group — 6.2% versus 8.9%. Yet the emergency group had a Quality Score of 9 while the general group sat at 5. Why? Because the emergency group converted at nearly 12%. Google rewards the ad that brings the right person, not the most people.
3. Account History Is a Real Factor
An account that has been consistently well-managed carries a trust signal that new accounts simply do not have. Identical campaign structures can perform differently based purely on account age and historical performance. This is why buying an aged Google Ads account — something agencies occasionally do — exists as a practice. Build account history slowly and never pause campaigns erratically.
4. Landing Page Speed Has a Ceiling Effect
Google’s own research found that pages taking longer than three seconds to load lose 53% of mobile visitors.
Source: Google/SOASTA Research — “The State of Online Retail Performance” (think.withgoogle.com)
However, once your page loads in under two seconds, further speed improvements produce diminishing returns on Quality Score. Fix obvious speed problems first — then focus your energy on message-match and relevance, which deliver far more Quality Score improvement per hour of work.
5. Post-Click Engagement Is the Invisible Signal
Google tracks what happens after someone clicks your ad. Users who immediately hit the back button — a behaviour called “pogo-sticking” — send a strong negative signal. Users who stay, scroll, and engage send a positive one. Over time, these signals aggregate into your landing page experience rating, which feeds directly into Quality Score.
What the Research Says
A 2022 analysis by SEMrush examining over 10,000 Google Ads campaigns across 15 industries found that campaigns with Quality Scores above 7 on their primary keywords had a 35% lower cost per acquisition compared to campaigns with Quality Scores between 3 and 6 — even when targeting the same keywords in the same geographic market.
Source: SEMrush State of Search Advertising Report 2022 (semrush.com/reports)
The practical implication is straightforward: improving Quality Score is not just an aesthetic metric. It is a direct cost-reduction mechanism. For a campaign spending 50,000 rupees per month, moving from Quality Score 5 to Quality Score 8 across primary keywords can reduce monthly spend requirement for the same results by 15,000 to 20,000 rupees.
Watch: Quality Score Explained Visually
The following video from Google’s official YouTube channel explains Quality Score in under six minutes and covers the three official factors with worked examples:
Video: “Understanding Quality Score” — Google Ads YouTube Channel
Search on YouTube: “Google Ads Quality Score explained Google” — look for the video from the official Google Ads channel. Embed the video directly if you have YouTube embed permissions on your WordPress site.
Source: Google Ads official YouTube channel (youtube.com/@GoogleAds)
Common Mistakes That Destroy Quality Score
- One ad group with dozens of unrelated keywords — the single most common mistake. Each ad group should contain only keywords that share the same search intent.
- Sending all traffic to the homepage — homepages are company overviews, not sales conversations. Create dedicated landing pages for each ad group.
- Ignoring the search terms report — check weekly and add irrelevant searches as negative keywords before they accumulate clicks.
- Writing generic ad copy — “Best service, call now” tells Google nothing about intent alignment. Mirror the keyword in the headline.
- Restarting campaigns frequently — every restart resets the learning period and clears accumulated Quality Score history. Pause sparingly.
The One Sentence That Explains Everything
If a user types a search, sees your ad, clicks it, and within three seconds thinks “yes, this is exactly what I was looking for” — your Quality Score will improve. Every structural recommendation in this article exists to create that single moment of perfect match between what the person wanted and what they found.
Your Action Steps This Week
- Open your Google Ads account and add the Quality Score column to your keyword view
- Identify every keyword with a Quality Score below 5
- Check which keywords share the same ad group — separate any that have different intents
- Review the landing page each low-scoring keyword sends traffic to — does the headline match the search?
- Download the free audit checklist below and work through it keyword by keyword
Free Download: Google Ads Quality Score Audit Checklist
A printable two-page checklist covering all five Quality Score factors with the exact questions to ask for every keyword in your account. Used internally on every new account audit.
Get the free checklist — enter your email and we will send it immediately
Last updated: May 2025. Google Ads interfaces and Quality Score documentation are reviewed quarterly. If you notice any outdated information, please email corrections@theopenhandbook.com.